Agentic UI Generation
How can we help our agentic friend to deliver visually distinct reports?
00

01

.overview
A design exploration into contextual, visually rich output experiences for financial AI agents on the Alfa platform.
.impact
The UI Gen POC validated that agent outputs can and should be visually distinct, data-forward, and tailored to their unique information structures. The work created a replicable foundation for contextual UI generation in Alfa.
.my role
Product designer
Alfa's AI agents deliver powerful financial analysis, but the way outputs were presented didn't match the sophistication of the underlying intelligence. Outputs were dense, uniform, and hard to scan. Analysts needed something meaningfully better.
Problem 01
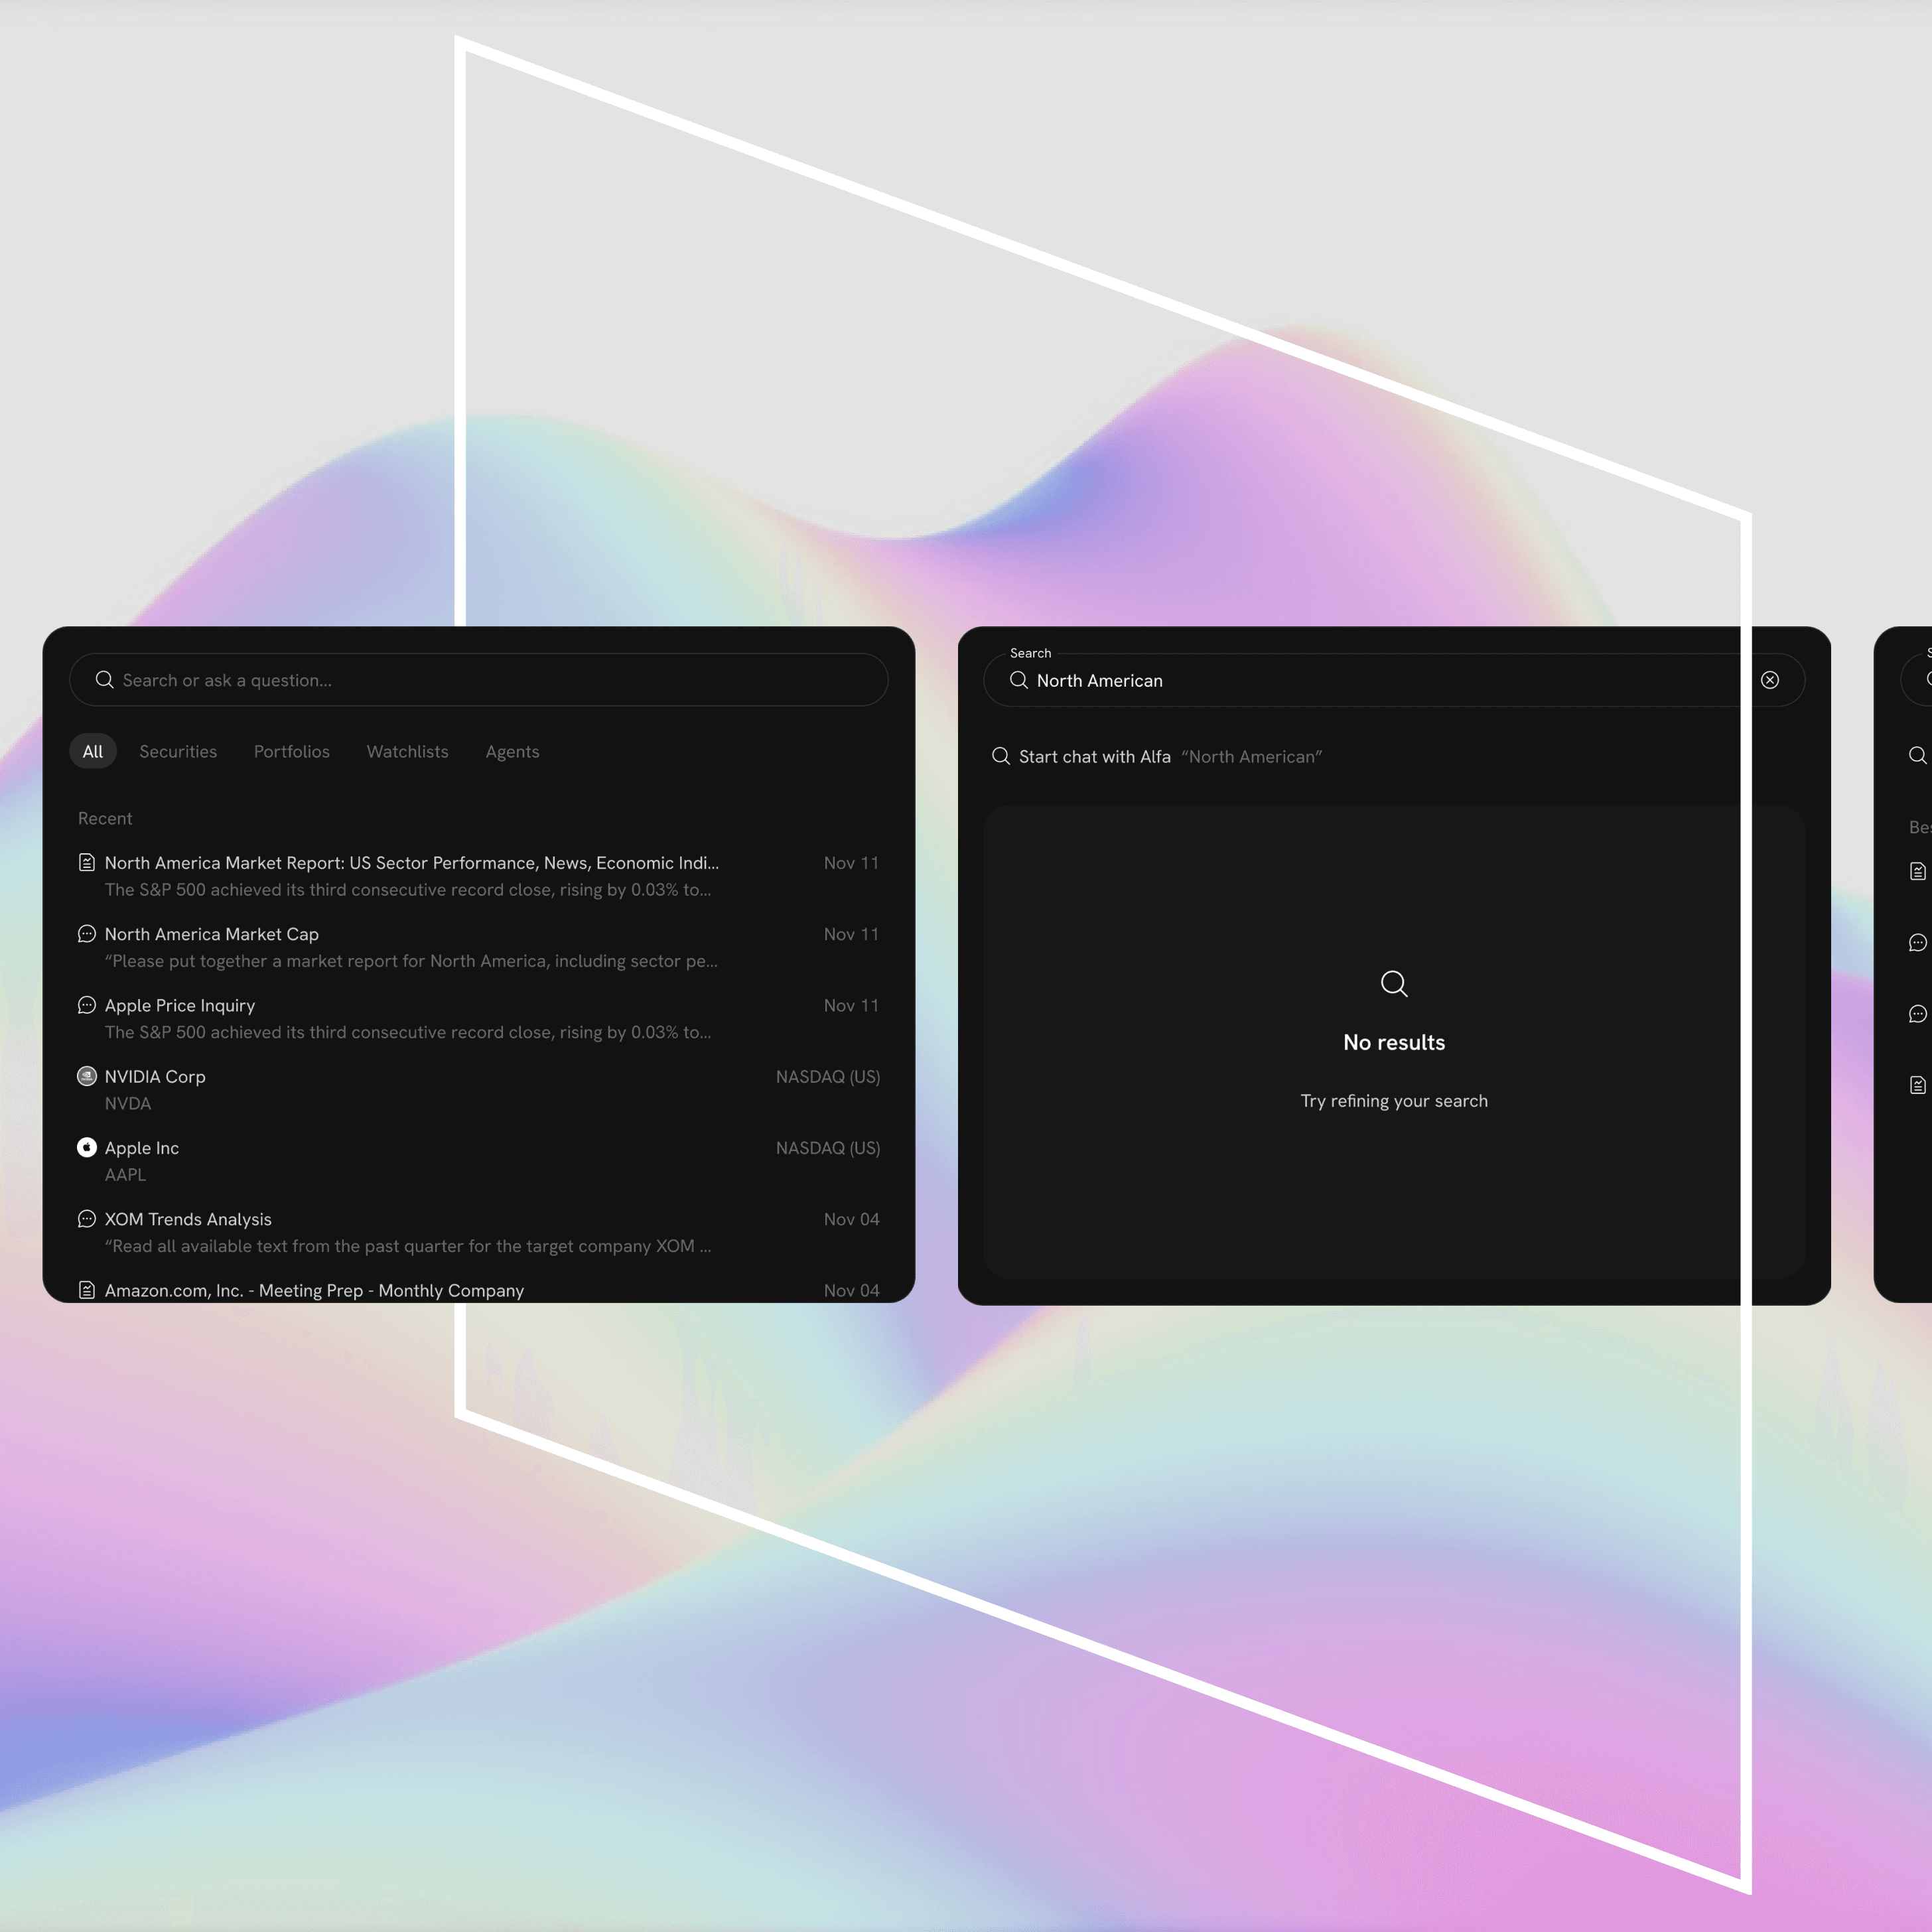
Outputs aren't scannable
Analysts want visually rich dashboards (charts, KPIs, and graphs) not walls of text and static tables that require careful reading to extract value.
Problem 02
All agents look the same
A Peer Comparison agent and an Earnings agent present fundamentally different information. Their UIs should reflect that; one layout template does not fit all.
Goal
Design a proof-of-concept demonstrating contextual, AI-generated UI layouts for each agent type that are visually compelling and uniquely tailored to its information structure.

.intent
Why did we build this?
Five agent types were identified as representative test cases, each with a distinct information structure and analytical purpose.
01
Peer Valuation
Stock-to-peer comparison using valuation multiples like P/E and EV/EBITDA across a defined peer group.
02
Event Analysis
Event-driven view mapping market events to stock price movements, with AI-generated summaries per event.
03
Industry Debrief
Sector-level briefing with key news, top & bottom stock performers, and macro market signals.
04
Meeting Prep
Structured meeting materials: company updates, industry context, Q&A prompts, and speaking points.
05
Macro Trends
S&P 500 view with tables, stock charts, and momentum analysis across the index — data-dense layout.

Initial Exploration
Running in parallel with product stakeholders, I defined the foundational design language and structural patterns that carried through the entire project.
01
Consistent Platform Chrome
All agents share the Alfa shell; sidebar nav with Home, Agents, Chat, Workflows, Knowledge, and a workspace header. Users always know where they are, regardless of which agent output they're viewing.
02
Data Before Text
Charts, KPI cards, and stock metrics surface above prose. Numbers and visuals carry the first impression. Detailed analysis text provides depth beneath. Tables become secondary to visual data representations.
03
Data & Change Awareness
Every agent output surfaces what's changed since the last run. A 'Most Recent Updates' module shows the delta — new events, added/removed stocks, revised metrics — rather than a static snapshot of current state.
.ideation
Mapping the design space
02

03

04

Three reusable design principles emerged from the explorations — patterns that apply across all agent types and can be systematically built into an AI layout generation system.
01
Visual Scannability
Charts and KPI metrics appear above text blocks
Color-coded signals for positive/negative changes
Tables are secondary to visual data representations
At-a-glance metric cards provide instant context
02
Contextual UI Layout
Each agent type has its own layout template
Information hierarchy reflects the agent's purpose
Peer Valuation = comparative; Events = temporal
Meeting Prep = editorial; Macro = data-dense
03
Delta & Change Awareness
Every output shows what is new since the last run
Added / removed items are surfaced distinctly
AI-generated highlights call out the key changes
Persistent 'Most Recent Updates' pattern across all agents
.conclusion
Key decisions made
01
Productionize patterns into reusable components
02
Build an agent UI component library for Alfa
03
Define an AI layout generation spec
04
Expand templates to additional agent types
05
User-test with financial analysts
.wrap up